|
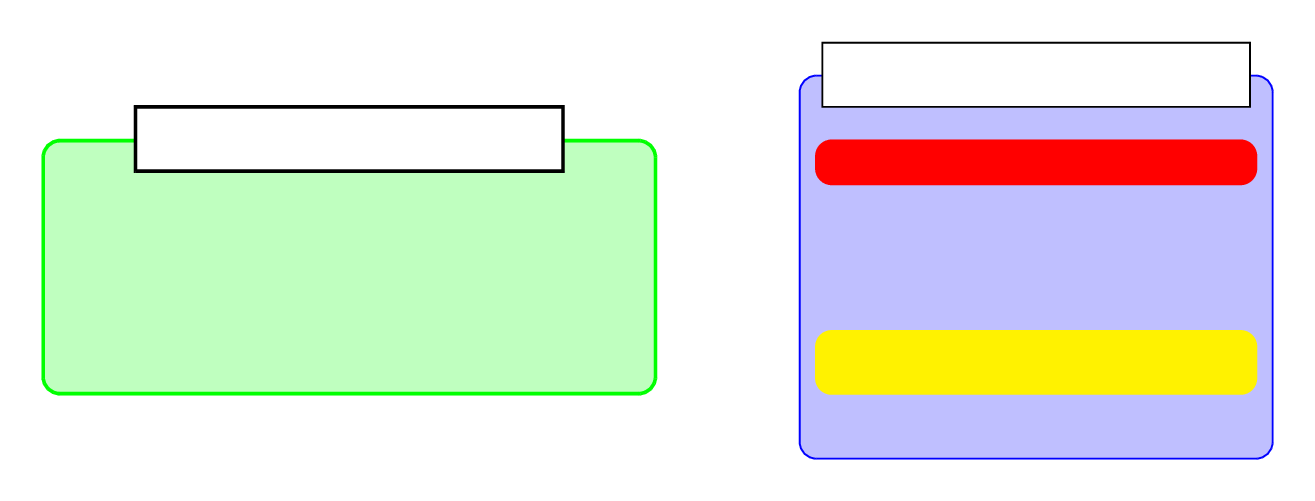
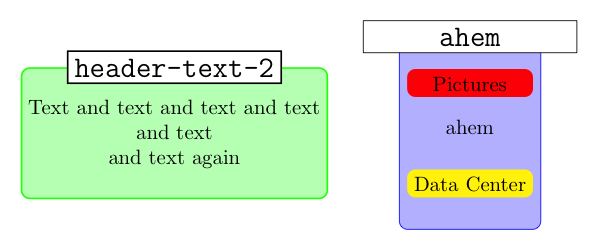
Je continue mes efforts pour réaliser des diagrammes. J'ai trouvé ceci, qui me convient assez. Je tente de le modifier pour le faire correspondre à mes besoins. J'ai réussi à maîtriser le positionnement et la couleur des nodes ainsi que les dimensions de la boîte qui les contient. Mais le texte n'est pas affiché ! Comment faire pour qu'il apparaisse ? 
Hélas, ce code TikZ fait référence à la librairie positioning-plus qui n'est plus vraiment maintenue. Et je ne comprends rien au fichier tikzlibrarypositioning-plus.code.tex : la compréhension de ce code est loin au-delà de mes modestes connaissances... mais j'ai pourtant besoin de ce type de diagrammes ! \documentclass[tikz, border = 10pt]{standalone} \usetikzlibrary{shapes.geometric, backgrounds, positioning-plus, node-families, calc} \tikzset{ basic box/.style = { shape = rectangle, align = center, draw = #1, fill = #1!25, rounded corners}, header node/.style = { Minimum Width = header nodes, font = \strut\Large\ttfamily, text depth = +0pt, fill = white, draw}, header/.style = {% inner ysep = +1.5em, append after command = { \pgfextra{\let\TikZlastnode\tikzlastnode} node [header node] (header-\TikZlastnode) at (\TikZlastnode.north) {#1} node [span = (\TikZlastnode)(header-\TikZlastnode)] at (fit bounding box) (h-\TikZlastnode) {} } }, hv/.style = {to path = {-|(\tikztotarget)\tikztonodes}}, vh/.style = {to path = {|-(\tikztotarget)\tikztonodes}}, fat blue line/.style = {ultra thick, blue} } \begin{document} \begin{tikzpicture}[node distance = 1.2cm, thick, nodes = {align = center}, >=latex] \node[Minimum Width = loop, shape = rectangle, rounded corners, fill = red] (pic) {Pictures} ; \node[Minimum Width = loop, shape = rectangle, rounded corners, fill = yellow, below = of pic] (data) {Data Center} ; \begin{scope}[on background layer] \node[fit = (pic)(data), basic box = blue, header = ahem] (test) {ahem}; \end{scope} \node[left = of test, basic box = green, header = header-text-2] (cs) {Text and text and text and text\\ and text\\and text again}; \end{tikzpicture} \end{document} |
|
Avec \documentclass[tikz, border = 10pt]{standalone} \usetikzlibrary{shapes.geometric, backgrounds, positioning-plus, node-families, calc} \tikzset{ basic box/.style = { shape = rectangle, align = center, draw = #1, fill = #1!25, rounded corners, text=black}, header node/.style = { Minimum Width = header nodes, font = \strut\Large\ttfamily, text depth = +0pt, fill = white, draw, text=black}, header/.style = {% inner ysep = +1.5em, append after command = { \pgfextra{\let\TikZlastnode\tikzlastnode} node [header node] (header-\TikZlastnode) at (\TikZlastnode.north) {#1} node [span = (\TikZlastnode)(header-\TikZlastnode)] at (fit bounding box) (h-\TikZlastnode) {} }, }, hv/.style = {to path = {-|(\tikztotarget)\tikztonodes}}, vh/.style = {to path = {|-(\tikztotarget)\tikztonodes}}, fat blue line/.style = {ultra thick, blue} } \begin{document} \begin{tikzpicture}[node distance = 1.2cm, thick, nodes = {align = center}, >=latex] \node[Minimum Width = loop, shape = rectangle, rounded corners, fill = red,text=black] (pic) {Pictures} ; \node[Minimum Width = loop, shape = rectangle, rounded corners, fill = yellow, below = of pic,text=black] (data) {Data Center} ; \begin{scope}[on background layer] \node[fit = (pic)(data), basic box = blue, header = ahem] (test) {ahem}; \end{scope} \node[left = of test, basic box = green, header = header-text-2] (cs) {Text and text and text and text\\ and text\\and text again}; \end{tikzpicture} \end{document}
|


Personnellement, pour ce type de figure j'utiliserai le paquetage
tcolorbox(basé surTikZ) qui est à la fois très puisssant et très souple et offre donc une foultitude de personnalisation pour des boîtes comme celles recherchées.