
|
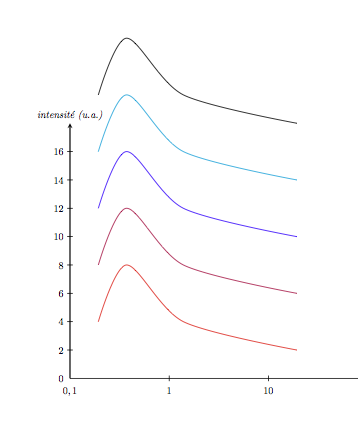
Grâce à : \begin{center} \begin{tikzpicture} \draw[->,>=stealth][very thin](0,0)--(18.5,0); \draw (16.5,-1) node[right] {$taille\, ($nm$)$}; \draw [->,>=stealth][very thick](0,0)--(0,9); \draw (0,9) node[above] {$intensité\, (u.a.)$}; \draw (0,-0.2) node[below] {$0,1$}; \draw (3.5,-0.2) node[below] {$1$}; \draw (3.5,-0.1)--(3.5,0.1); \draw (7,-0.2) node[below] {$10$}; \draw (7,-0.1)--(7,0.1); \draw (10.5,-0.2) node[below] {$100$}; \draw (10.5,-0.1)--(10.5,0.1); \draw (14,-0.2) node[below] {$1000$}; \draw (14,-0.1)--(14,0.1); \draw (17.5,-0.2) node[below] {$10000$}; \draw (17.5,-0.1)--(17.5,0.1); \draw (-0.1,0) node[left] {$0$}; \draw (-0.1,1) node[left] {$2$}; \draw(-0.1,1)--(0.1,1); \draw (-0.1,2) node[left] {$4$}; \draw(-0.1,2)--(0.1,2); \draw (-0.1,3) node[left] {$6$}; \draw(-0.1,3)--(0.1,3); \draw (-0.1,4) node[left] {$8$}; \draw(-0.1,4)--(0.1,4); \draw (-0.1,5) node[left] {$10$}; \draw(-0.1,5)--(0.1,5); \draw (-0.1,6) node[left] {$12$}; \draw(-0.1,6)--(0.1,6); \draw (-0.1,7) node[left] {$14$}; \draw(-0.1,7)--(0.1,7); \draw (-0.1,8) node[left] {$16$}; \draw(-0.1,8)--(0.1,8); \draw[thick,smooth,color=red] plot file {DLS_pluroniqueF127_conc50_temp20.txt}; \draw[thick,smooth,color=purple] plot file {DLS_pluroniqueF127_conc50_temp25.txt}; \draw[thick,smooth,color=blue] plot file {DLS_pluroniqueF127_conc50_temp30.txt}; \draw[thick,smooth,color=bleuturquoise] plot file {DLS_pluroniqueF127_conc50_temp35.txt}; \draw[thick,smooth,color=black] plot file {DLS_pluroniqueF127_conc50_temp40.txt}; \end{tikzpicture} \end{center} Je trace cinq courbes sur un même graphique. Je souhaiterais translater quatre d'entre elles vers le haut afin de rendre le graphique plus lisible. Comment faire pour « shifter » la deuxième courbe de 2 cm, la troisième de 4 cm, la quatrième de 6 cm et la cinquième de 8 cm vers le haut afin qu'elle ne se recouvrent pas, en sachant que les valeurs sont dans des fichiers .txt ? Nota : les valeurs sont données à titre indicatif. |
|
On pourrait utiliser Sans rapport avec le problème :
\documentclass{article}

\usepackage{tikz}
\colorlet{bleuturquoise}{cyan}

\usepackage{filecontents}
\begin{filecontents*}{test.txt}
1 2
2 4
4 2
8 1
\end{filecontents*}

\begin{document}

\begingroup
\centering
\begin{tikzpicture}
\draw[->,>=stealth][very thin](0,0)--(18.5,0);
\draw (16.5,-1) node[right] {\textit{taille (nm)}};
\draw [->,>=stealth][very thick](0,0)--(0,9);
\draw (0,9) node[above] {\textit{intensité (u.a.)}};
\draw (0,-0.2) node[below] {$0{,}1$};
\draw (3.5,-0.2) node[below] {$1$};     \draw (3.5,-0.1)--(3.5,0.1);
\draw (7,-0.2) node[below] {$10$};      \draw (7,-0.1)--(7,0.1);
\draw (10.5,-0.2) node[below] {$100$}; \draw (10.5,-0.1)--(10.5,0.1);
\draw (14,-0.2) node[below] {$1000$}; \draw (14,-0.1)--(14,0.1);
\draw (17.5,-0.2) node[below] {$10000$}; \draw (17.5,-0.1)--(17.5,0.1);

\draw (-0.1,0) node[left] {$0$};
\draw (-0.1,1) node[left] {$2$};  \draw(-0.1,1)--(0.1,1);
\draw (-0.1,2) node[left] {$4$}; \draw(-0.1,2)--(0.1,2);
\draw (-0.1,3) node[left] {$6$}; \draw(-0.1,3)--(0.1,3);
\draw (-0.1,4) node[left] {$8$}; \draw(-0.1,4)--(0.1,4);
\draw (-0.1,5) node[left] {$10$}; \draw(-0.1,5)--(0.1,5);
\draw (-0.1,6) node[left] {$12$}; \draw(-0.1,6)--(0.1,6);
\draw (-0.1,7) node[left] {$14$}; \draw(-0.1,7)--(0.1,7);
\draw (-0.1,8) node[left] {$16$}; \draw(-0.1,8)--(0.1,8);

\draw[thick,smooth,color=red,yshift=0cm] plot file {test.txt};
\draw[thick,smooth,color=purple,yshift=2cm] plot file {test.txt};
\draw[thick,smooth,color=blue,yshift=4cm] plot file {test.txt};
\draw[thick,smooth,color=bleuturquoise,yshift=6cm] plot file {test.txt};
\draw[thick,smooth,color=black,yshift=8cm] plot file {test.txt};

\end{tikzpicture}
\endgroup

\end{document}
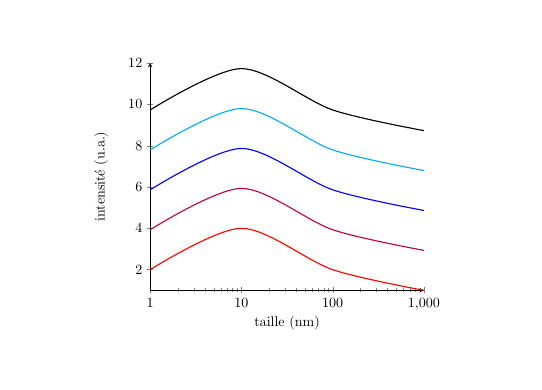
Une autre solution avec l'extension \documentclass{article} \usepackage{pgfplots} \colorlet{bleuturquoise}{cyan} \usepackage{filecontents} \begin{filecontents*}{test.txt} 1 2 10 4 100 2 1000 1 \end{filecontents*} \begin{document} \begingroup \centering \begin{tikzpicture} \begin{axis}[ xlabel={taille (nm)}, ylabel={intensité (u.a.)}, axis lines=left, ymax=12, xmode=log, log ticks with fixed point, ] \addplot [red,thick,smooth] table {test.txt}; \addplot [purple,thick,smooth,yshift=1cm] table {test.txt}; \addplot [blue,thick,smooth,yshift=2cm] table {test.txt}; \addplot [bleuturquoise,thick,smooth,yshift=3cm] table {test.txt}; \addplot [black,thick,smooth,yshift=4cm] table {test.txt}; \end{axis} \end{tikzpicture} \endgroup \end{document}
Quelle est l'utilité de "log ticks with fixed point" ? 3
@ettoremajorana C'est pour avoir Comment afficher la légende des courbes ? 4
@ettoremajorana Merci de poser une nouvelle question pour avoir de l'aide sur l'affichage de la légende de courbes. |

Chiffeter? :o)
mais pour les figures type graphiques mathématiques, il faut mieux privilégier
pgfplotsnon ? Redessiner les axes et tout en permanence, c'est vraiment fastidieux !@ettoremajorana Pourriez-vous s'il vous plaît accepter une réponse.