|
Je suis en train de peaufiner un graphique : \begingroup \centering \begin{tikzpicture} \begin{axis}[ title={Taille des particules de F127 pour $c_{m} = 20\, g.L^{-1}$ pour différents mélanges eau:THF}, xlabel={taille (nm)}, xmode=log, ylabel={intensité (u.a.)}, ymax=50, mark size=0.5pt, width=1\textwidth, % log ticks with fixed point ] \addplot [Plum,thick,smooth,x=X, y=Intensity, yshift=0cm] table [col sep=tab] {DLS_pluroniqueF127_conc20_eau100_THF0_20190225.txt}; \addplot [RoyalBlue,thick,smooth,x=X, y=Intensity, yshift=0cm] table [col sep=tab] {DLS_pluroniqueF127_conc20_eau80_THF20_20190225.txt}; \addplot [LimeGreen,thick,smooth,x=X, y=Intensity, yshift=0cm] table [col sep=tab] {DLS_pluroniqueF127_conc20_eau60_THF40_20190225.txt}; \addplot [Goldenrod,thick,smooth,x=X, y=Intensity, yshift=0cm] table [col sep=tab] {DLS_pluroniqueF127_conc20_eau40_THF60_20190225.txt}; % \addplot [Orange,thick,smooth,x=X, y=Intensity, yshift=0cm] table [col sep=tab] {DLS_pluroniqueF127_conc20_eau20_THF80_20190225.txt}; \addplot [Red,thick,smooth,x=X, y=Intensity, yshift=0cm] table [col sep=tab] {DLS_pluroniqueF127_conc20_eau100_THF0_20190225.txt}; % addplot [red,thick,smooth] table {test.txt}; \end{axis} \end{tikzpicture} \endgroup Comment ajouter la légende (et non dans le graphique) sous le graphique de manière élégante ? |
|
On peut ajouter une légende avec \documentclass{article} \usepackage{pgfplots} \usepackage{pgfplotstable} \pgfplotsset{compat=1.16} \colorlet{bleuturquoise}{cyan} \usepackage{siunitx} \usepackage{filecontents} \begin{filecontents*}{test.txt} 1 2 10 4 100 2 1000 1 \end{filecontents*} \begin{document} \begingroup \centering \begin{tikzpicture} \begin{axis}[ title={Taille des particules de F127 pour $c_{m} = \SI{20}{g.L^{-1}}$ pour différents mélanges eau:THF}, xlabel={taille (nm)}, xmode=log, ylabel={intensité (u.a.)}, ymax=50, mark size=0.5pt, width=1\textwidth, legend style={at={(0.5,-0.15)},anchor=north}, legend columns=5, ] \addplot [red,thick,smooth] table {test.txt}; \addplot [purple,thick,smooth] table[x index = 0, y expr={\thisrowno{1} + 6}] {test.txt}; \addplot [blue,thick,smooth] table[x index = 0, y expr={\thisrowno{1} + 12}] {test.txt}; \addplot [bleuturquoise,thick,smooth] table[x index = 0, y expr={\thisrowno{1} + 18}] {test.txt}; \addplot [black,thick,smooth] table[x index = 0, y expr={\thisrowno{1} + 24}] {test.txt}; \legend{$d=2$,$d=3$,$d=4$,$d=5$,$d=6$}, \end{axis} \end{tikzpicture} \endgroup \end{document} 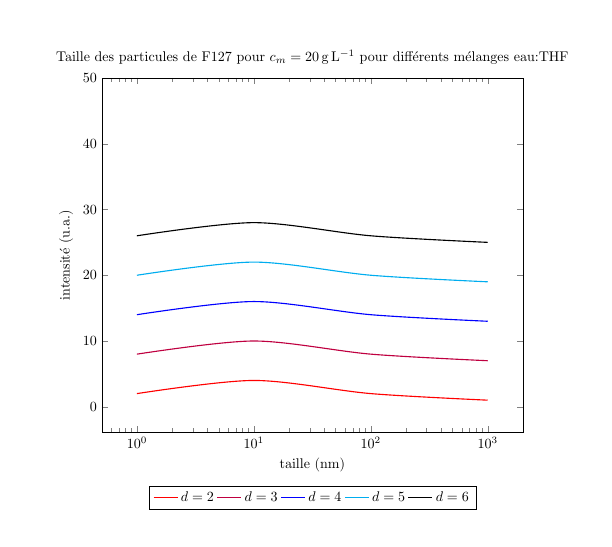
Sans rapport avec le problème, je suggère d'utiliser l'extension |
|
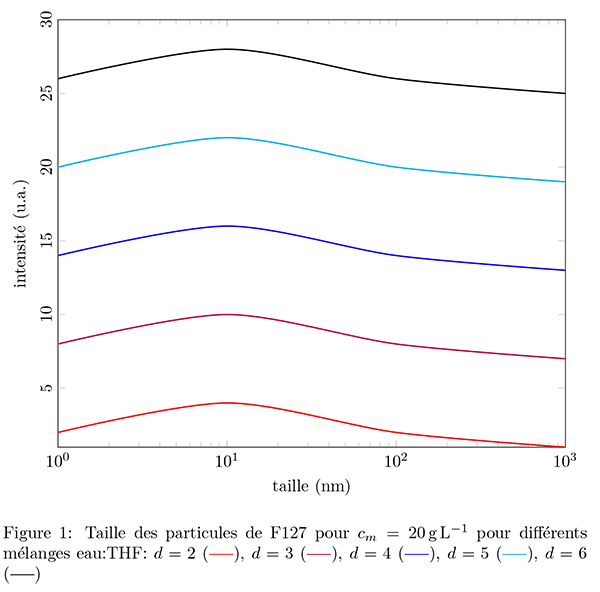
Une solution avec la légende dans le titre de la figure: \documentclass{article} \usepackage[utf8]{inputenc} \usepackage{pgfplots} \usepackage{pgfplotstable} \pgfplotsset{compat=1.14} \colorlet{bleuturquoise}{cyan} \usepackage{siunitx} \usepackage{filecontents} \begin{filecontents*}{test.txt} 1 2 10 4 100 2 1000 1 \end{filecontents*} \DeclareRobustCommand{\CourbeRD}{(\tikz[baseline=-\the\dimexpr\fontdimen22\textfont2\relax,inner sep=0pt] \draw[red,line width=0.5pt](0,0) -- (5mm,0);)} \DeclareRobustCommand{\CourbePL}{(\tikz[baseline=-\the\dimexpr\fontdimen22\textfont2\relax,inner sep=0pt] \draw[purple,line width=0.5pt](0,0) -- (5mm,0);)} \DeclareRobustCommand{\CourbeBU}{(\tikz[baseline=-\the\dimexpr\fontdimen22\textfont2\relax,inner sep=0pt] \draw[blue,line width=0.5pt](0,0) -- (5mm,0);)} \DeclareRobustCommand{\CourbeBL}{(\tikz[baseline=-\the\dimexpr\fontdimen22\textfont2\relax,inner sep=0pt] \draw[black,line width=0.5pt](0,0) -- (5mm,0);)} \DeclareRobustCommand{\CourbeBT}{(\tikz[baseline=-\the\dimexpr\fontdimen22\textfont2\relax,inner sep=0pt] \draw[bleuturquoise,line width=0.5pt](0,0) -- (5mm,0);)} \begin{document} \begin{figure}[ht] \centering \begin{tikzpicture} \begin{axis}[ xlabel={taille (nm)}, xmode=log, ylabel={intensité (u.a.)}, ymax=30, y tick label style={rotate=90,anchor=south}, mark size=0.5pt, enlargelimits=false, width=1\textwidth, ] \addplot [red,thick,smooth] table {test.txt}; \addplot [purple,thick,smooth] table[x index = 0, y expr={\thisrowno{1} + 6}] {test.txt}; \addplot [blue,thick,smooth] table[x index = 0, y expr={\thisrowno{1} + 12}] {test.txt}; \addplot [bleuturquoise,thick,smooth] table[x index = 0, y expr={\thisrowno{1} + 18}] {test.txt}; \addplot [black,thick,smooth] table[x index = 0, y expr={\thisrowno{1} + 24}] {test.txt}; %\legend{$d=2$,$d=3$,$d=4$,$d=5$,$d=6$}, \end{axis} \end{tikzpicture} \caption{Taille des particules de F127 pour $c_{m} = \SI{20}{g.L^{-1}}$ pour différents mélanges eau:THF: $d=2$ \CourbeRD, $d=3$ \CourbePL, $d=4$ \CourbeBU, $d=5$ \CourbeBT, $d=6$ \CourbeBL} \end{figure} \end{document}
|