
|
Je voudrais mettre des barres d'erreurs verticales sur mon graphe, plus exactement sur chaque point expérimental. L'erreur est la même pour chaque point : elle est de 6nm. Les ordonnées dans les parenthèses sont des valeurs en nm. Comment faire ? \begingroup \centering \begin{tikzpicture} \begin{axis}[ xlabel={SV duration (min)}, ylabel={correlation length $\kappa$ (nm)}, axis lines=left, grid=major, xmin=0, xmax=3000, ymin=0, ymax=700, xmode=log, log ticks with fixed point, width=0.85\textwidth,grid=major ] \addplot [blue,mark size=2pt,only marks] coordinates {(10,111)(10,87)(10,112)(50,116)(50,153)(100,131)(100,124)(100,172)(200,113)(200,102)(200,95)(300,74)(300,87)(300,116)(300,94)(400(102)(400,69)(400,127)(600,299)(600,201)(600,221)(700,214)(700,156)(700,263)(800,128)(800,96)(800,116)(900,185)(900,183)(900,158)(1000,160)(1000,150)(1000,162)(1000,154)(1100,181)(1100,132)(1100,127)(1200,127)(1200,154)(1200,122)}; \addplot [red,mark size=1.5pt,only marks] coordinates {(1,115)(10,119)(20,138)(30,100)(100,126)(140,139)(190,110)(300,150)(400,178)(1000,563)(2900,117)}; \addplot [mark=*,mark size=1.5pt,red,thick,smooth] table {table_correlation_20200206.txt}; \addplot [mark=*,mark size=1.5pt,blue,thick,smooth] table {table_correlation_20200213.txt}; \legend{20200213,20200206}; \end{axis} \end{tikzpicture} \endgroup |
|
On peut utiliser \documentclass{article} \usepackage{pgfplots} \begin{document} \begingroup \centering \begin{tikzpicture} \begin{axis}[ xlabel={SV duration (min)}, ylabel={correlation length $\kappa$ (nm)}, axis lines=left, grid=major, %xmin=0, xmax=3000, ymin=0, ymax=700, xmode=log, log ticks with fixed point, width=0.85\textwidth,grid=major, error bars/y dir=both, error bars/y fixed=6, ] \addplot [blue,mark size=0.5pt,only marks] coordinates {(10,111)(10,87)(10,112)(50,116)(50,153)(100,131)(100,124)(100,172)(200,113)(200,102)(200,95)(300,74)(300,87)(300,116)(300,94)(400(102)(400,69)(400,127)(600,299)(600,201)(600,221)(700,214)(700,156)(700,263)(800,128)(800,96)(800,116)(900,185)(900,183)(900,158)(1000,160)(1000,150)(1000,162)(1000,154)(1100,181)(1100,132)(1100,127)(1200,127)(1200,154)(1200,122)}; \addplot [red,mark size=0.5pt,only marks] coordinates {(1,115)(10,119)(20,138)(30,100)(100,126)(140,139)(190,110)(300,150)(400,178)(1000,563)(2900,117)}; %\addplot [mark=*,mark size=1.5pt,red,thick,smooth] table {table_correlation_20200206.txt}; %\addplot [mark=*,mark size=1.5pt,blue,thick,smooth] table {table_correlation_20200213.txt}; \legend{20200213,20200206}; \end{axis} \end{tikzpicture} \endgroup \end{document} 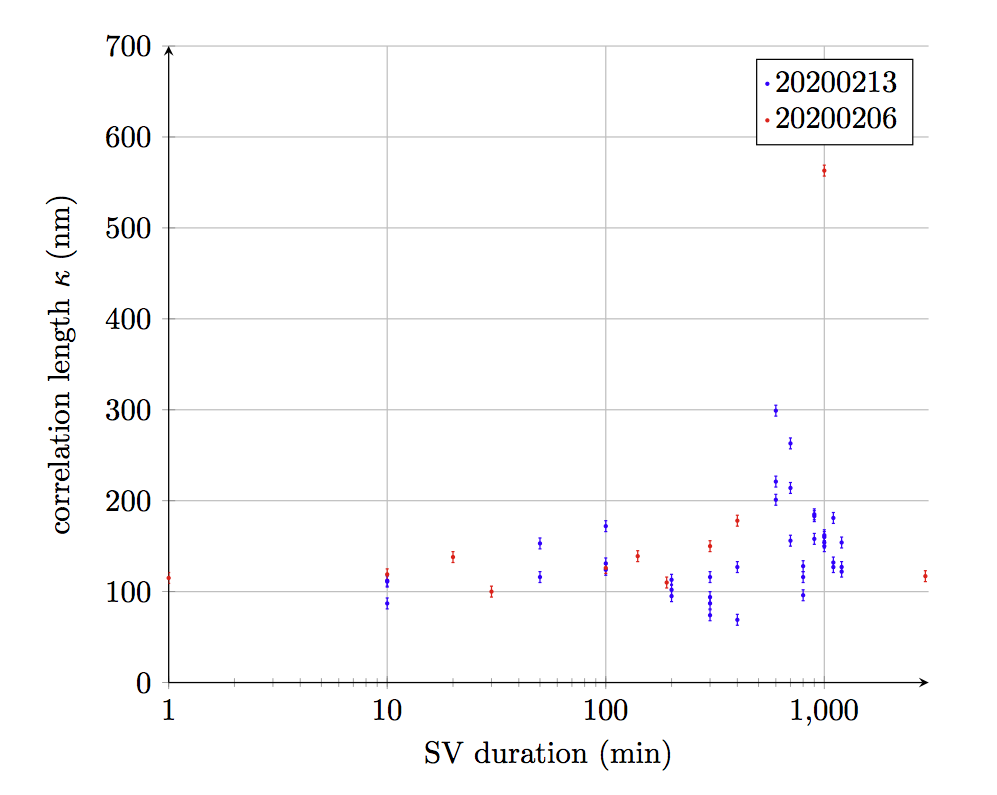
|
